Table of Contents
KRIYA Booking System has a Sales Report feature, which is used to Monitor your Business’s Revenue and Sales Performance. Sales Report comes with a Date Filter, Display and Export Options.
Navigation to Reports: #
- Login to KRIYA. Click on Reports in the left Main Menu.
- Click on Revenue Report to view the Reports page.
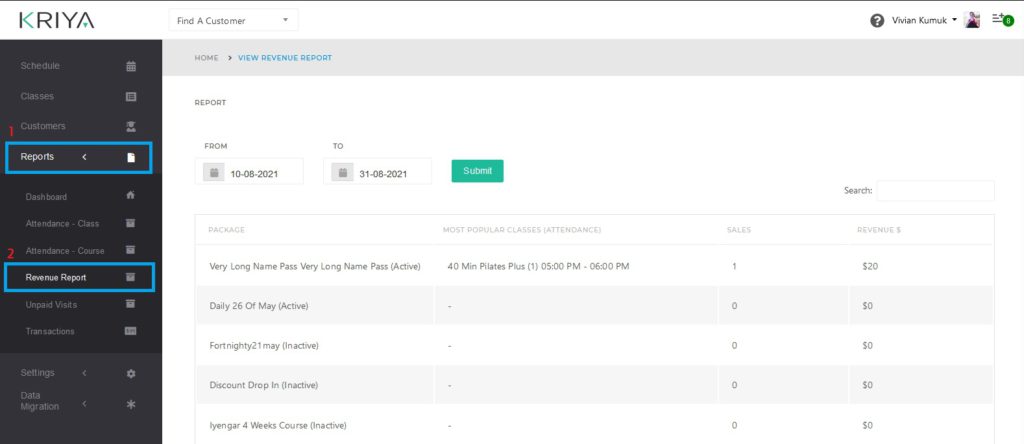
Revenue List Data Columns #
Revenue Reports has 4 Data Columns: Packages, Attendance, Sales and Revenue. Let us see them.
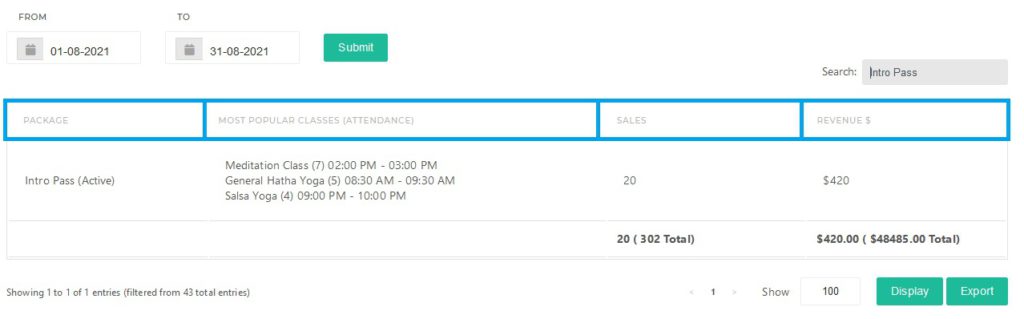
- Package: This Column shows the Package/Pass that was bought generating Revenue.
- Attendance: Column shows the most attended classes or Sessions using the adjacent pass in the package column.
- Sales: This shows the total number of times a package was bought during the selected duration.
- Revenue: Displays the Total Amount of Revenue generated through the sales of a Package.
In the Bottom of the Data List, we can see the Total Sales and Total Revenue generated by the Business within the selected Filters & Options.
Filters & Options for Revenue Report Generation #
KRIYA has to-the-point Filters and Options for a clutter-free Viewing Experience. You can use Dates Filter, View Minimalist Column Report by applying Options and Export with multiple File Types.
- Date Filter: Use Date Filter to view Reports made during the selected period. The report will include data from both the selected dates.
From: Select the starting date in this Date Table.
To: Select the last date you want to view the report.
Example: If I want a Revenue report from 1st Jan 2021 to 11 Jan 2021, I will select the Dates, 1 Jan in the “From” Date Table and 11 Jan in the “To” Date Table. - Search Box: You can search for anything related to the list, like the amount and package name.
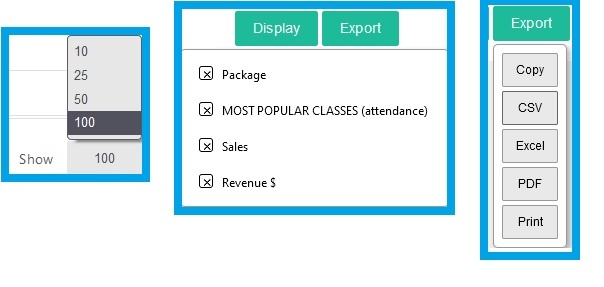
Example: If I want to see Revenue Report only made by a particular package, like “Intro Pass”. I will type “Intro Pass” in the search box. - Show: Select the number of rows you want to display on the current page. 100 is selected by default. Select from “10” to “100” the number of lists to show on a single page.
- Display Button: Use it to Show and Hide columns in the Revenue Report, you can Check to Show, and Uncheck to Hide the columns.
Suppose you do not want the “MOST POPULAR CLASSES (attendance)” column. Uncheck the tick box to hide it. - Export Button: This Option will let you download all the data loaded with applied Filters and options. Copy and download the list in CSV, Excel, PDF, or Print Directly.
Remember, only the data shown on all the pages will be exported, copied, or printed.